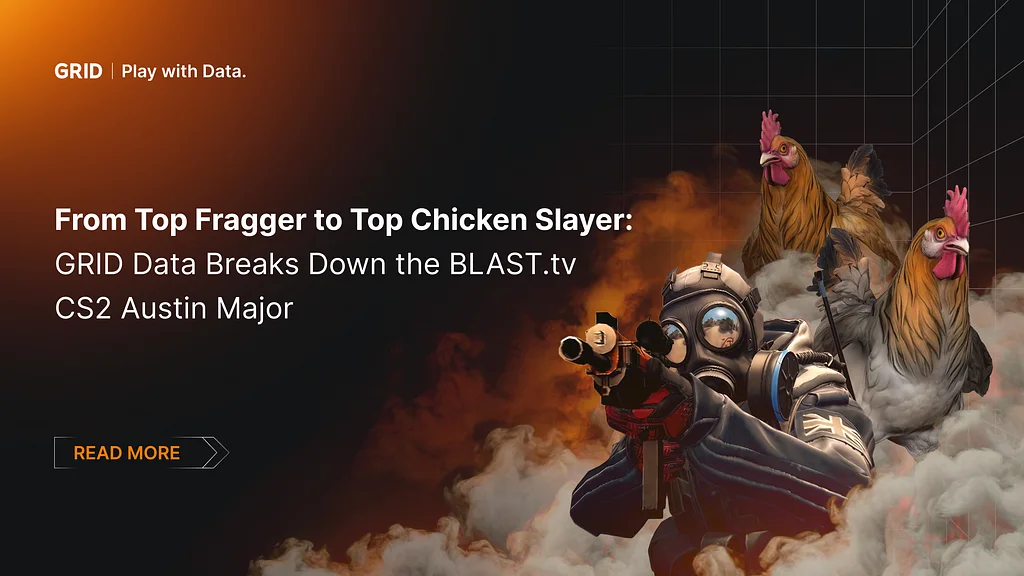
From top Fragger to Top Chicken Slayer: GRID Data Breaks Down the BLAST.tv CS2
What the report saysAs the BLAST.tv CS2 Austin Major became the most-watched Counter-Strike event in history — its venue in Austin, TX packed with fans torn between all-time legends Team Vitality and the tournament’s…
What the report says
As the BLAST.tv CS2 Austin Major became the most-watched Counter-Strike event in history — its venue in Austin, TX packed with fans torn between all-time legends Team Vitality and the tournament’s ultimate underdog, The MongolZ — the GRID Data Platform was capturing a different kind of spectacle: every kill, every headshot, every chicken eliminated, registered as live data.As BLAST’s official esports data partner, GRID captures in-game data live, directly from the game server, the moment each legendary play unfolds. Our esports-dedicated technology ensures all data is accurate, real-time, and trusted across the competitive gaming ecosystem.We’ve now released a comprehensive roundup of player, match, and tournament stats from the record-breaking BLAST.tv CS2 Austin Major in June to provide a new, data-powered perspective on this exciting tournament.All data was captured from June 3–22, covering both the Swiss stages and the live event in Austin, TX.Overall tournament statsNearly 600 chickens were killed throughout the Austin MajorEx3rcice (3DMAX) had 15 total chicken kills — 2.5% of all 584 chickens slain during the tournament.
The Finals alone had just 15 chicken kills, while over 478 were put to rest during the Swiss stages, highlighting how the action tightened and became more focused in the final matches.Round intensity increased as the tournament progressedOf the 3,700 total rounds played, 1,646 (44%) ended without a bomb plant — suggesting a strong prevalence of quick engagements, site control, or clean defensive wins. But in high-stakes playoff matches, defusal and detonation events increased, reflecting tighter, more strategic play.More deaths than kills? Here’s whyThe tournament recorded 24,365 deaths but only 24,198 kills.
That discrepancy — 167 deaths — can be attributed to environmental causes like fire, bomb, and fall damage, as well as utility self-harm, which don’t credit a kill to an opponent but still affect match outcomes.Planting wasn’t always part of the planOut of 3,700 rounds, only 2,054 included a bomb plant, meaning nearly 45% of all rounds ended before a site was even reached. This stat underlines the dominance of aggressive CT play or early picks that shut down T-side momentum.Top-performing players in AustinZywOo outperformed the field in K/DHis 1.64 K/D was 14% higher than the tournament average (approx.

Key details
1.50), showcasing standout efficiency, even though his average kills per game (16.69) was slightly below the tournament average (17.45). He focused on quality over quantity — taking fewer deaths while doing more damage with a +6742 Damage Differential (highest of the tournament).donk led the tournament in fragging powerHis 1.43 K/D was just below the top tier but backed by a tournament-high 22.42 kills per game — nearly 28% above the tournament average (~17.5). That level of output, paired with a +2876 damage differential (+410.85 Avg/Game), made donk the most aggressive and effective fragger in Austin, despite Team Spirit’s early playoff exit.Senzu was above average in kills and precisionAveraging 18.21 kills/game, he outpaced the tournament average by 0.76 kills and posted a 63.1% headshot rate — well above the field average (~55%).
Finals pressure saw Senuzu’s performance drop-off, though — his K/D in the finals (1.10) was down 19% from his overall tournament average (1.36). His kills per game also dropped from 18.2 → 15.0, and headshot % dipped slightly (63.1% → 62.2%).ropz rebounded from a poor ESL Pro League with a strong showingHe recorded a 1.32 K/D at BLAST compared to just 0.81 at the prior event — a 63% improvement. His headshot rate of 50.53% was slightly below average, but his overall impact (positive damage differential: +3384) made him a key closer.adamb had the highest headshot % — but struggled elsewhereDespite a tournament-best 75.6%headshot rate, adamb had one of the lowest K/Ds (0.87) and only 13.67 kills/game, suggesting mechanical talent but potential limitations in positioning or survivability.Mzinho and Senzu confirmed The MongolZ’s precision-focused styleThe pair combined for 130+ headshots with team-leading headshot percentages (67.9% and 63.1%), establishing The MongolZ as one of the most accurate rosters in the tournament.Austin Major finalists: side-by-sideIf you’re interested in accessing live esports data or want to bring your game onto the GRID to unlock the full potential of data-driven storytelling for your esports scene, reach out to us at [email protected] GRIDGRID is a data platform powering competitive gaming — capturing every moment and play to transform raw game data into commercial and fan-facing opportunities.
 Pacific vs. Americas: Which VALORANT region is truly the strongest in VCT 2026?
 Stake Referral Code: Use CANMAX to enter the Raffle
 Get another look at Yakuza Kiwami 3 & Dark Ties and hear
 We Built a VALORANT Super Team